Dashboard
Recent performance, upcoming posts, alerts. Your daily 60-second check.
For everyone
Workspaces see their own data. Hubs see network-wide rollups across every location.
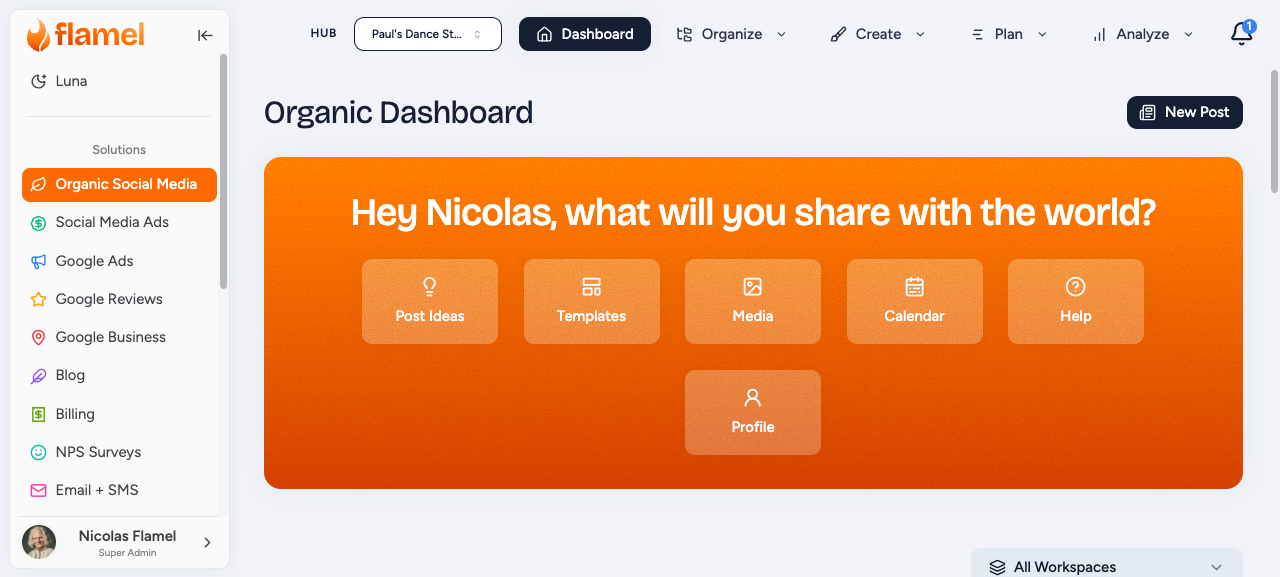
The dashboard is your daily 60-second check: recent performance, upcoming posts, and alerts in one place.
What's on it
Recent performance shows past 7 days of engagement trends so you can spot what content is working. Upcoming content lists scheduled posts that are about to publish, giving you a last chance to review before they go live. Alerts surface anything that needs attention: expiring connections, failed posts, and items waiting on approval.
Connection health
Color-coded indicators flag connections before they cause failed posts.
| Status | What it means | Action |
|---|---|---|
| Green | Connection healthy | None |
| Yellow | Token expiring soon | Reconnect soon |
| Red | Connection broken, posts are failing | Reconnect now |
Fixing a flagged connection
Click any yellow or red connection to re-authenticate. Reconnecting clears the alert and resumes publishing.
Your daily check
Run this top-to-bottom each morning. It takes about a minute.
Confirm every connection is green
Scan the connection health indicators. If anything is yellow or red, click it to reconnect before it blocks today's posts.
Review what's publishing today
Check the upcoming content section. Confirm the scheduled posts look right and nothing needs a last-minute edit.
Clear any red alerts
Work through the alerts panel: failed posts, expiring connections, and items waiting on approval. Resolve the red ones first.
Check yesterday's performance
Glance at recent performance to see how the past 7 days of content performed and spot any trends worth acting on.
Module dashboards
Each solution has its own dashboard with metrics relevant to that area.