Paid Analytics
Track campaign performance, compare spend vs. results across your locations and export reports for stakeholders.
For Hub admins and Workspace owners with paid ads access
Hub admins see cross-workspace analytics. Workspace owners see their own location's paid performance only.
The Paid Analytics Dashboard shows campaign performance across every Meta and Google Ads campaign running through Flamel. Use it to understand which campaigns are working, how spend compares to results and how each location is performing relative to the network.
Open Paid Analytics
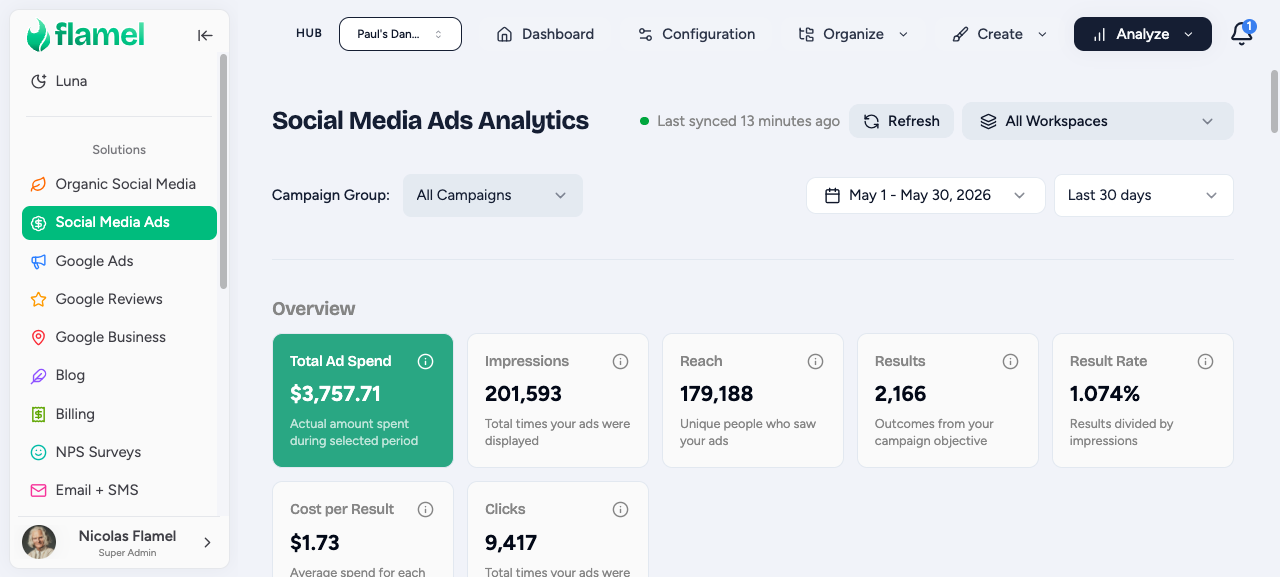
In the left menu, open Paid Social Ads, then Analyze, then Analytics.
Key Metrics On Your Paid Analytics Dashboard
| Metric | What It Measures |
|---|---|
| Impressions | Number of times your ads were shown |
| Clicks | Number of times users clicked your ads |
| CTR | Click-through rate (clicks / impressions) |
| Spend | Total amount spent in your designated time period |
| Results | Conversions tracked (leads, purchases or events, depending on objective) |
| Cost per result | Total spend / results |
| ROAS | Return on ad spend (revenue / spend, where tracked) |
What the Results Column Counts
Meta lets an ad set optimize for one goal inside a campaign that carries a different objective. Flamel labels the Results column with the goal the ad set actually optimizes for. A Sales campaign whose ad sets optimize for landing page views now reads Page Views, not Purchases.
Other labels you can see include Link Clicks, Leads, Reach, Impressions, Engagements, Page Likes, Event Responses, ThruPlays, Video Views, Calls and Profile Visits.
Read the label, not the objective
The label tells you what Meta counted. Two campaigns with the same objective can report different result types, because their ad sets optimize for different goals.
Date Range & Filters
Use the date range and filter controls at the top of the dashboard to view results by:
- Date ranges: Compare any two periods, or use presets (today, last 7 days, last 30 days, last quarter)
- Platform: Filter to Meta or Google Ads only
- Campaign type: Filter by objective (Awareness, Traffic, Leads, Sales)
- Workspace (Hub view): Filter to a single location or compare a selection
- Command Group: Filter to the campaigns in a specific Command Group
Command Group Metrics
When you pick a Command Group, Flamel adds up every workspace in that group. CPM, CPC, CTR and Frequency now show real values in that view. They read zero before this fix, while spend and impressions looked correct.
ROAS across more than one workspace is now a spend weighted average. A workspace that spends more moves the group ROAS more than a workspace that spends very little.
A weighted ROAS reads lower than the old figure
The old number treated a $50 workspace and a $5,000 workspace as equals, which pushed the group ROAS up. The weighted number is the true return for the money the group spent. A lower figure after this change is a correction of the math, not a decline in performance.
Cross-Workspace Comparison (Hub View Only)
Hub admins see a table with one row per workspace showing spend, results and cost per result. Sort by any column to find:
- Locations spending heavily with low results (targeting or creative issue)
- Locations with excellent cost per result to learn from and replicate
- Locations with zero activity that should have active campaigns
Sort by cost per result to find outliers fast
The best and worst performers are always at the extremes. High cost-per-result locations usually have one of the following fixable issues: Wrong radius in Ad Configuration, stale creative or a disconnected pixel.
Digging Into Campaign Details
Click any campaign row to see its performance breakdown across impressions, clicks, spend and results by date and ad set.
From their detailed view, you can:
- Open the campaign in Meta Ads Manager for direct edits.
- Link the campaign to a Flamel workspace, if it appears unattributed.
- See which ad sets are driving results and which are stalled.
See a Live Ad Preview
From Ad Creative analytics, select an ad and click Live preview to see it exactly as Meta renders it right now, across four placements: Desktop, Mobile, Instagram, and IG Story. The same Live preview button appears on your opted-in playbooks. It pulls the live creative straight from Meta, so it always reflects the current copy, media, and any lead form attached to the ad.
Leads
Open Paid Social Ads, then Analyze, then Leads to see every synced Meta lead in your scope. This page is not limited to the dashboard's date range: it covers all campaigns and all dates.
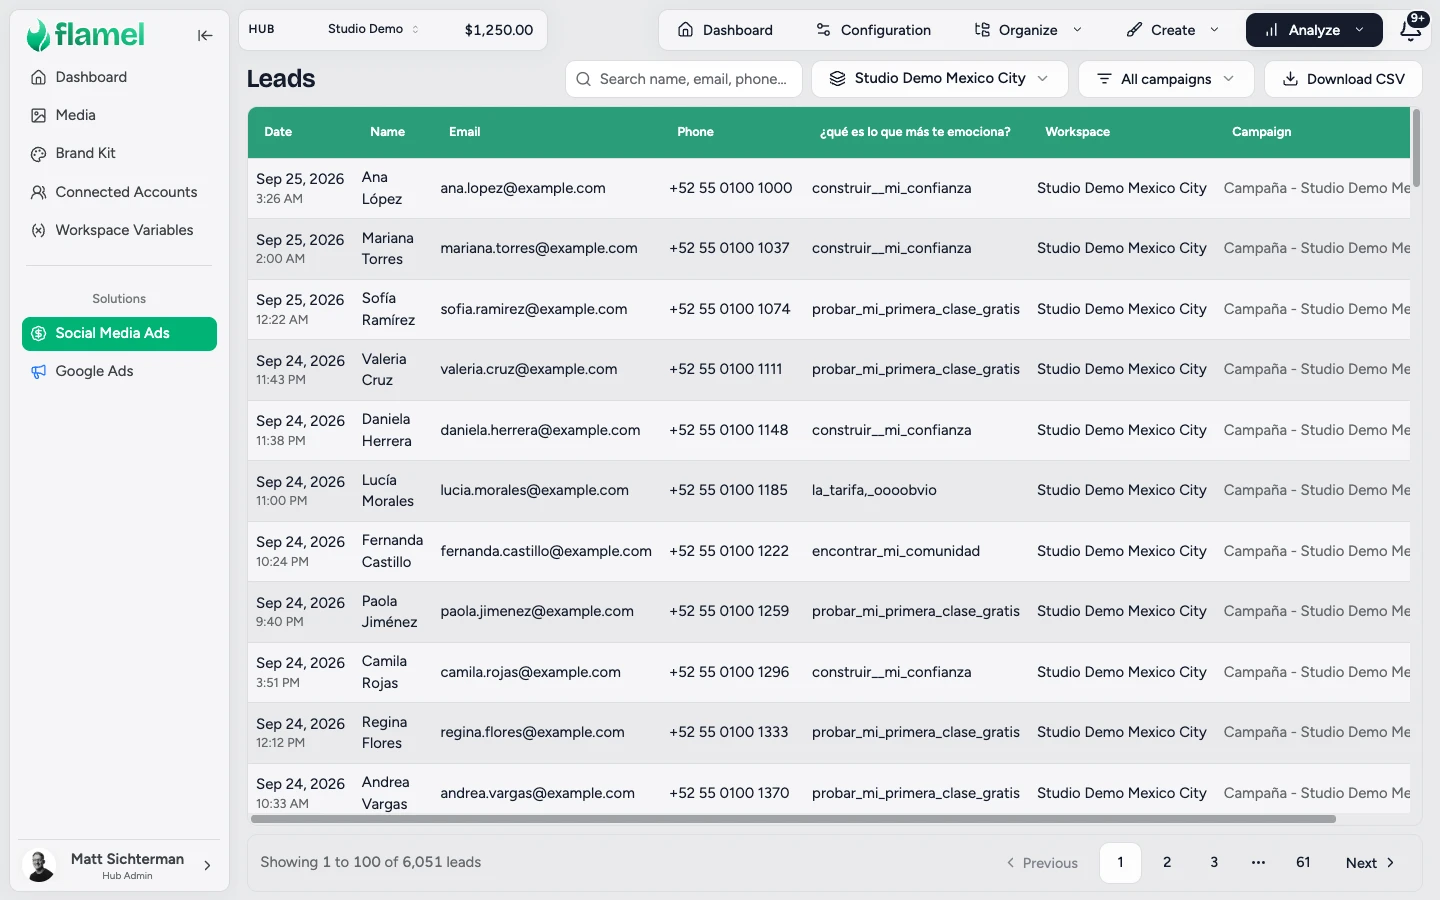
Search by name, email, or phone, filter to a campaign or to particular workspaces, then export what you see as a CSV. A hub admin sees every workspace in the hub, and a workspace user sees only their own leads.
Forms written in another language
Meta keys each answer by the question in the form's language. Flamel matches the English and Spanish contact fields, so a Spanish form fills the Name, Email, and Phone columns instead of leaving them empty, and every other question the lead answered gets its own column. See Lead forms for the details.
Spend Analytics
Analytics tells you how the ads performed. Spend Analytics tells you where the money went, and how much is still promised.
Open it on the lefthand menu. Go to Paid Social Ads, then Analyze, then Spend.
The Cards at the Top
| Card | What It Means |
|---|---|
| Spent | Real spend that Meta reports for the selected dates |
| Committed | Budget that running campaigns still plan to spend inside the selected dates |
| Management Fee | Your hub fee, applied on top of Spent plus Committed. Shown only when a fee is set |
| Total | The projected total: Spent plus Committed, plus the fee |
Spent is money that is already gone. Committed is money that is still promised. Flamel limits each projection to the campaign schedule, so a campaign that ends on the 20th adds no committed budget after that date.
Hub admins set the fee percentage from the Add fee button in the page header. Leave it empty to report ad spend only. If your hub sets no fee, the fee column does not appear, and Total equals Spent plus Committed.
The Spend Report
Below the cards, the Spend Report splits your date range into periods. Use the Weekly and Daily tabs to change the grouping.
- Daily gives one column per day.
- Weekly gives seven day blocks. The blocks start on the first day of your range, so a report that starts mid month does not open with a stub column. Any days left over become one shorter final block.
Each row is a workspace. The period columns hold the spend for each period. After them, every row ends with:
- Spend: total spend for the whole range
- Committed: budget still scheduled to run in the range. This column appears only when something is still scheduled
- Management Fee: your hub fee on that row, when your hub sets a fee
- Total: spend plus committed, plus the fee
A Total row at the bottom adds up every workspace on screen. Spend that Flamel cannot tie to any workspace appears as Unattributed spend.
Click Export CSV to download the report. Flamel builds the file and the table from the same numbers, so the two can never disagree. Use the export for stakeholder reporting and to reconcile against your Meta invoice.
Open One Workspace
Hub admins see one card per workspace under Workspaces. Each card shows that workspace's Spent, Committed, fee and Total. Select a card to open the workspace.
The workspace view shows a Campaign Breakdown table. Each row is one playbook opt-in. The row carries the deployed campaign name, the run dates, and the live status that Meta reports right now, for example Active, Paused or With Issues. Rows with no spend, no committed budget and no live campaign stay hidden, so the table shows only what has money attached.
Three extra rows can appear below the playbook rows:
- Unmatched Flamel campaigns: Flamel spend that no playbook row claims. Treat this as an attribution warning and link the campaign from the campaign detail view.
- Other running Meta campaigns: budget still committed in the ad account by campaigns that Flamel did not deploy.
- External Meta campaigns: spend from campaigns that somebody built directly in Meta Ads Manager, outside Flamel.
Use these rows to see the full picture of an ad account, not only the part that playbooks control.
Who Sees Which Workspaces
A hub admin sees every workspace in the hub, and can open any one of them. A workspace user sees only their own workspace. Flamel enforces this on the server, so a workspace user cannot reach another location's spend.
The Spend Tracker in the Header
While you work in Paid Social Ads, a dollar figure sits in the top header. Select it to open the Spend Tracker. The popover shows Spent, Committed, your hub fee, and the largest spenders in your scope.
The Week and Month tabs cover the whole calendar period. In the middle of August, the Month tab reads "Aug 1 - Aug 31". Committed therefore includes budget that is scheduled for days that have not run yet. The headline number adds your hub fee on that projection.
The header total can be larger than the Spend page total
The Spend page presets "This week" and "This month" still end at today. The Spend Tracker runs to the end of the period. Under the same preset name, the tracker can report a larger Committed total than the page.
This is expected, and both numbers are correct for the window they cover. A bigger number in the header does not mean new spend occurred. It means the tracker counts budget that is scheduled for the days still to come.
How Fresh Is Your Data
The Analytics dashboard and Spend Analytics both show a last sync stamp. The stamp reports the oldest account in the set, not the newest.
This matters on a hub with many ad accounts. Accounts sync in turn, so the newest sync is almost always seconds old. Reporting the oldest one means a single fresh account cannot hide an account that last synced two days ago. Read the stamp as "every account synced within this long".
On Spend Analytics, select the refresh button next to the stamp to queue a new sync with Meta. Flamel tells you when the sync finishes and updates the numbers.
How to Export Reports
Click Export at the top of any view to download its current table as a CSV. Use it for:
- Stakeholder reporting (send monthly performance summaries)
- Billing reconciliation (match Flamel spend data to Meta invoice)
- Analyzing historical trends in an easy-to-read spreadsheet
Attribution
When you run campaigns through a connected ad account, Flamel automatically ties that performance back to the right workspace.
See Google Ads for details on how Google Ads attribution works.
Unattributed campaigns
Campaigns that appear in a connected ad account but are not tied to a Flamel workspace show up in the Unattributed section. Assign them from the campaign detail view.
Own Ad Account per Workspace (Hub admins)
If every workspace runs its own dedicated Meta ad account, turn on Own ad account per workspace from the Settings gear on the Paid Analytics dashboard. Attribution then matches analytics directly to each workspace's ad account instead of inferring it from pages and Instagram profiles, which improves accuracy. It also changes how playbooks select ad accounts and name ad sets across your network.
Match How Your Franchisees Run Ads
Enable this only when every workspace owns a dedicated ad account. Leave it off if your workspaces share a single ad account.