Analytics Overview
Cross-platform summary of reach, engagement, followers, and posting frequency across all your connected accounts.
Who Can See This
Workspace owners see their own workspace's analytics.
Hub admins see network-wide analytics and can filter by workspace.
The Analytics Overview summarizes how your organic content performs across platforms.
How To Open Analytics Overview
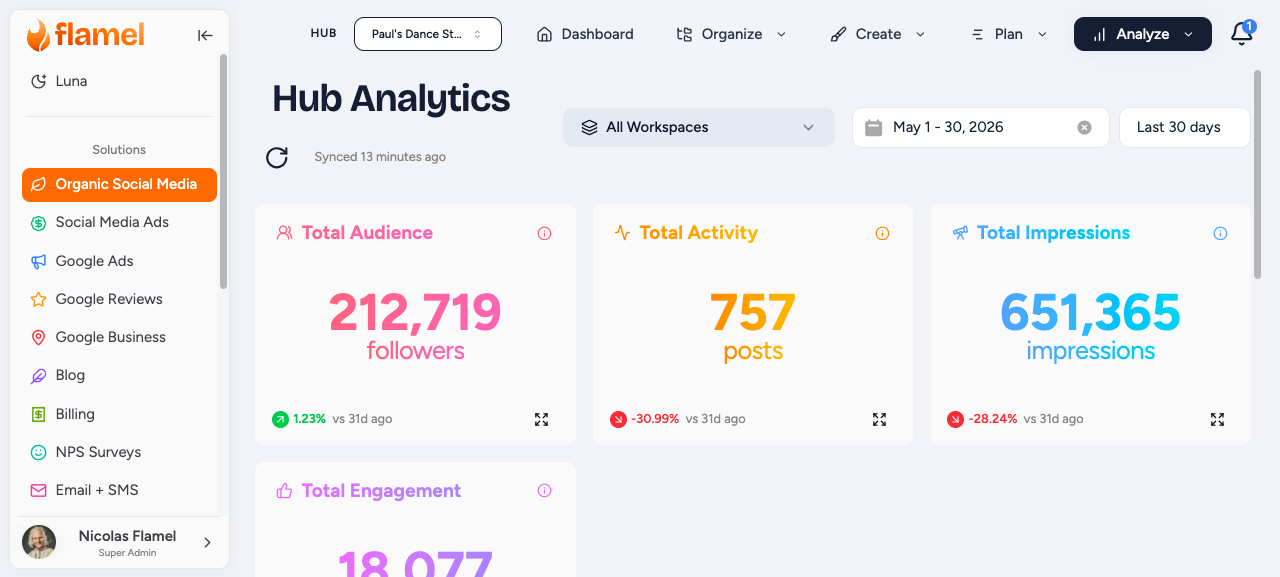
Navigate to Organic Social > then Analyze > then Overview.
What The Overview Shows
Performance Summary
The top of the page shows key metrics for the selected date range:
| Metric | What it measures |
|---|---|
| Reach | Unique accounts that saw your content |
| Impressions | Total content views, including repeat views |
| Engagement | Total likes, comments, shares, saves, and clicks |
| Engagement rate | Engagements divided by reach |
| Followers | Net follower growth during the selected period |
| Posts published | Total posts published during the selected period |
Organic analytics now count organic posts only
Flamel counts organic posts only in every organic total, ranking, Top Content list, digest email, and Luna answer.
Two kinds of paid ad creative are excluded. The first is Instagram media that only ever ran as an ad. The second is Facebook posts that never published to your Page. A boosted organic post still counts as organic, because you published it to your feed first.
If your organic numbers read lower than they used to, this is why. Paid ad creative used to inflate them. No post and no data was lost, and the organic count is now correct. Review paid performance in Paid Social Ads analytics, where that spend belongs.
How to See Specific Platforms Analytics
Below the summary, metrics are broken out by platform (Facebook, Instagram, LinkedIn, TikTok, X) so you can see where your audience is most active and which platforms are growing.
Trend Charts
Line charts show how metrics change over time. Sudden increases or decreases may be tied to specific posts, campaigns, or publishing activity.
Top Content by Platform
At the bottom of the page, Top Content by Platform shows the strongest post from each connected platform, ranked by total impressions. Select See content insights to open the full Content Insights view.
This block waits for its data. The page holds a loading state until the content arrives, then draws the cards. It no longer shows an error screen if you open Analytics before the content data lands.
To revisit what you published in earlier years, open the Memories tab in Content Insights.
Filter the data
Use the controls at the top of the page to focus your analysis:
- Date range: Select a preset range or choose a custom timeframe.
- Platform: Filter to a single platform to remove cross-platform noise.
- Workspace (Hub view only): Filter to a single workspace to assess one location.
fEMV & Benchmarks (Hub admins)
Franchisee Earned Media Value (fEMV) estimates the dollar value of your network's organic reach based on what the same impressions would cost as paid ads. Configure it from the Settings gear on the Analytics Overview; every workspace inherits the values in its own analytics.
Enable fEMV Calculation
Toggle Enable fEMV Calculation on. Flamel then calculates an fEMV for organic reach across every workspace in your hub. Turn it off any time to hide fEMV from analytics views.
Set a CPM for Each Platform
Under Platform CPM Values, enter what you pay (or would pay) per 1,000 impressions on each platform. These drive the equivalent ad spend Flamel attributes to organic content.
| Platform | What the CPM Represents |
|---|---|
| Cost per 1,000 Facebook impressions | |
| Cost per 1,000 Instagram impressions | |
| Cost per 1,000 LinkedIn impressions | |
| Twitter/X | Cost per 1,000 Twitter/X impressions |
| TikTok | Cost per 1,000 TikTok impressions |
How the Math Works
fEMV multiplies organic impressions by the platform CPM, then divides by 1,000. A $13 Facebook CPM against 10,000 organic impressions is an fEMV of $130.
Choose a Benchmark
Pick how Flamel compares performance across your network. Franchise Average compares each workspace against your network's average; Industry Average compares against industry-standard benchmarks. Choose whichever gives franchisees the most useful context.
Related Articles
Performance broken down by content type, format, and characteristics.
Your best-performing posts ranked by reach, engagement, or engagement rate.
Hub view: compare performance across every workspace in the network.
See what you have scheduled and plan content to fill gaps.