By Workspace
Compare organic social performance across every workspace in your network to identify top performers, growth opportunities, and performance trends.
For Hub Admins
By Workspace is a Hub-only view. It shows organic social performance across all workspaces in your network. Workspace owners see their own analytics in the Overview tab.
Open Organic Social > Analyze > By Workspace.
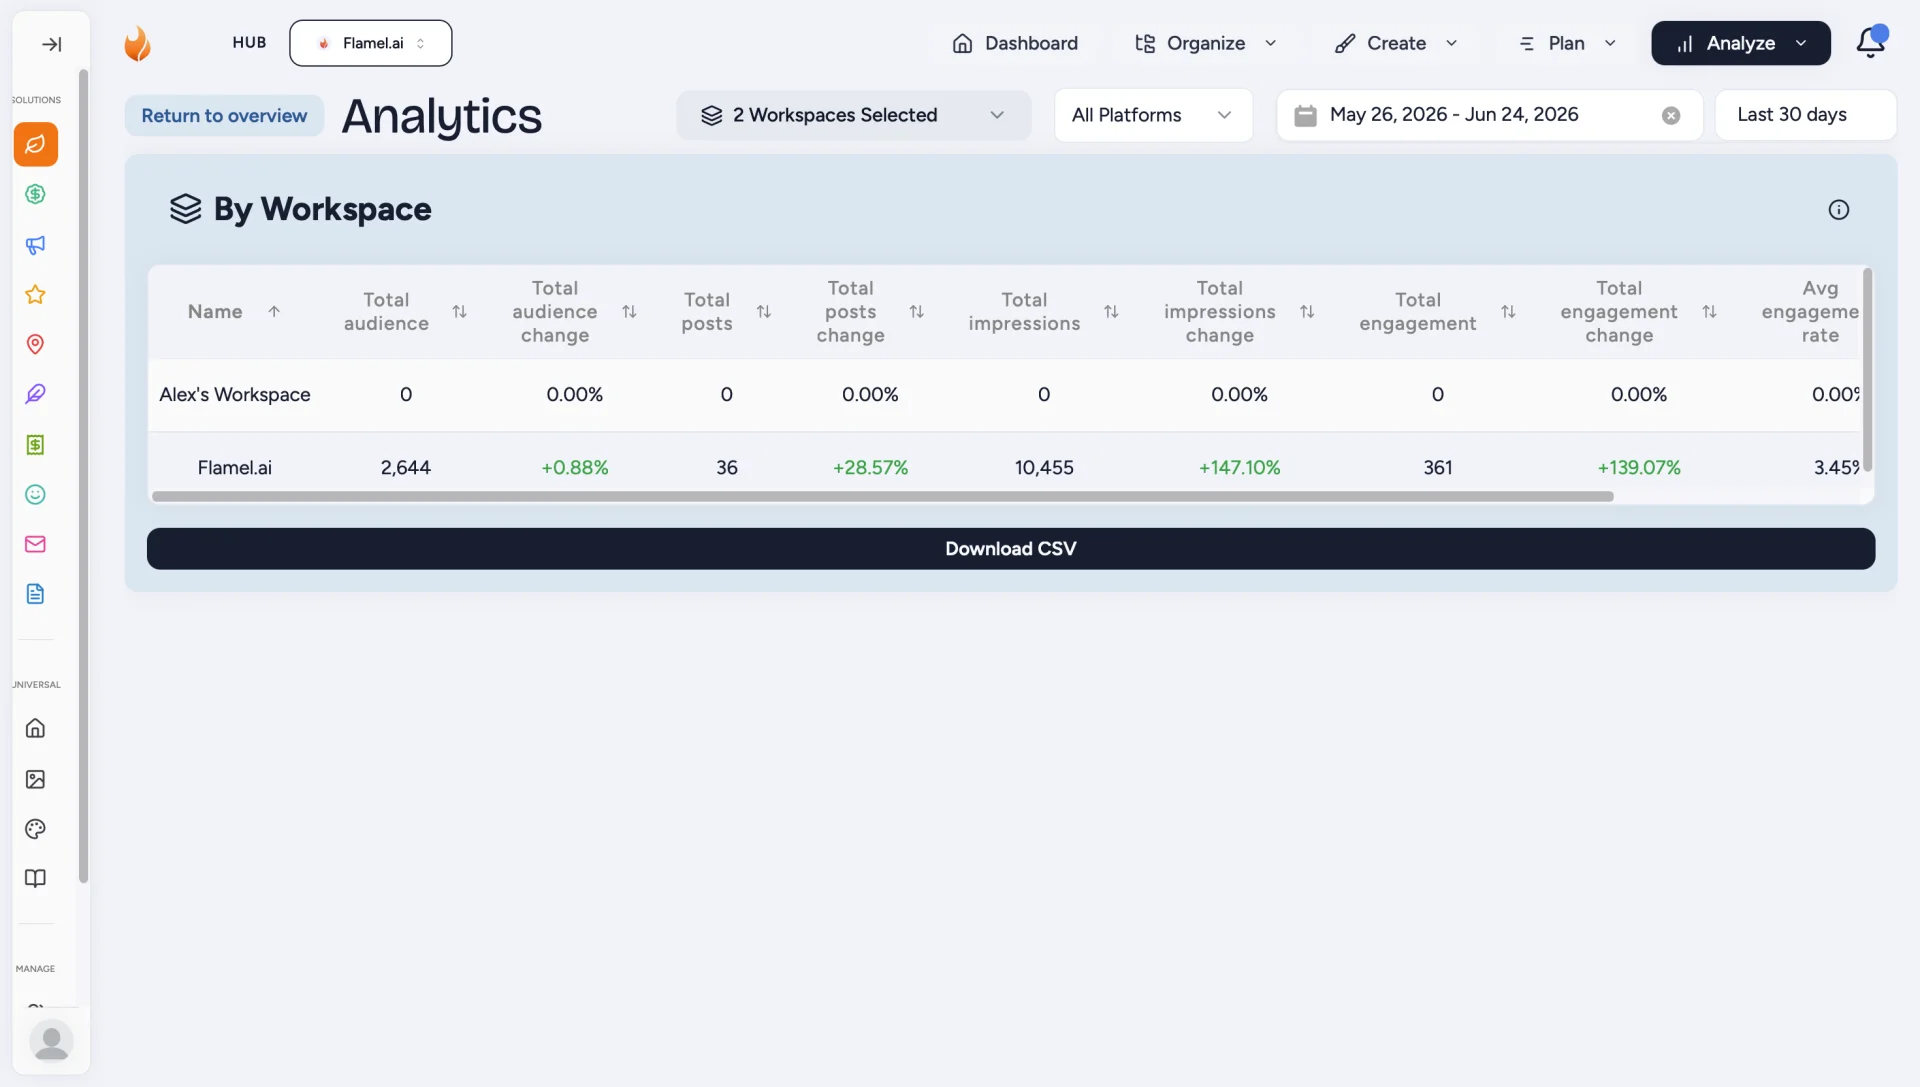
What the Table Shows
Each row represents one workspace location. The columns compare performance across the network for the selected date range.
Click any column header to sort. Click any row to open that workspace's detailed analytics.
Here is a breakdown of the metrics shown in the table:
| Metric | What it Shows |
|---|---|
| Total Audience | Total followers across all connected social media accounts for the workspace |
| Total Audience Change | Change in follower count during the selected date range |
| Total Posts | Posts published from this workspace during the selected period |
| Total Posts Change | Change in publishing volume compared to the previous period |
| Total Impressions | Total times content appeared in users' feeds |
| Total Impressions Change | Change in impressions compared to the previous period |
| Total Engagement | Total interactions including likes, comments, shares, saves, and clicks |
| Total Engagement Change | Change in engagement compared to the previous period |
| Avg Engagement Rate | Average engagement rate across published content during the selected period |
| Avg Engagement Rate Change | Change in average engagement rate compared to the previous period |
Filters
Use filters to narrow the data and focus on specific workspaces, platforms, or time periods.
- Workspace: Select one or more workspaces to view specific locations.
- Platform: all platforms, or a specific one (Instagram, Facebook, LinkedIn, TikTok, X)
- Time period: this week, this month, this quarter, year-to-date, or a custom range
Identifying Performance Trends
Use the table to compare workspace performance across your network.
Some common patterns to look for include:
- High Engagement Rates: Locations with strong engagement often have content strategies worth sharing across the network.
- Low Posting Activity: Locations with few or no posts may need additional support or content planning.
- Strong Growth: Workspaces with increasing audience, impressions, or engagement may be using tactics that can be replicated elsewhere.
- Performance Gaps: Large differences between similar locations can highlight opportunities for coaching, training, or content improvements.
Click any workspace to view detailed analytics and explore the content driving its results.
Related Articles
Cross-platform summary for a single workspace or the full network.
Best-performing posts ranked by reach, engagement, or engagement rate.
Turn on fEMV, set platform CPMs, and pick a benchmark for this view.
Help underperforming locations plan and schedule content to fill the gaps.