Compare Franchise Locations' Social Media Performance
Compare social media performance across franchise locations to identify top performers, spot trends, and find opportunities to improve.
Compare workspace performance in Hub analytics to find strong locations, identify patterns, and see where support is needed.
You can compare organic social performance in the Organic Social solution and review paid social advertising performance from the Meta Ads, Google Ads, and ChatGPT Ads solutions.
Compare Organic Social Performance by Workspace
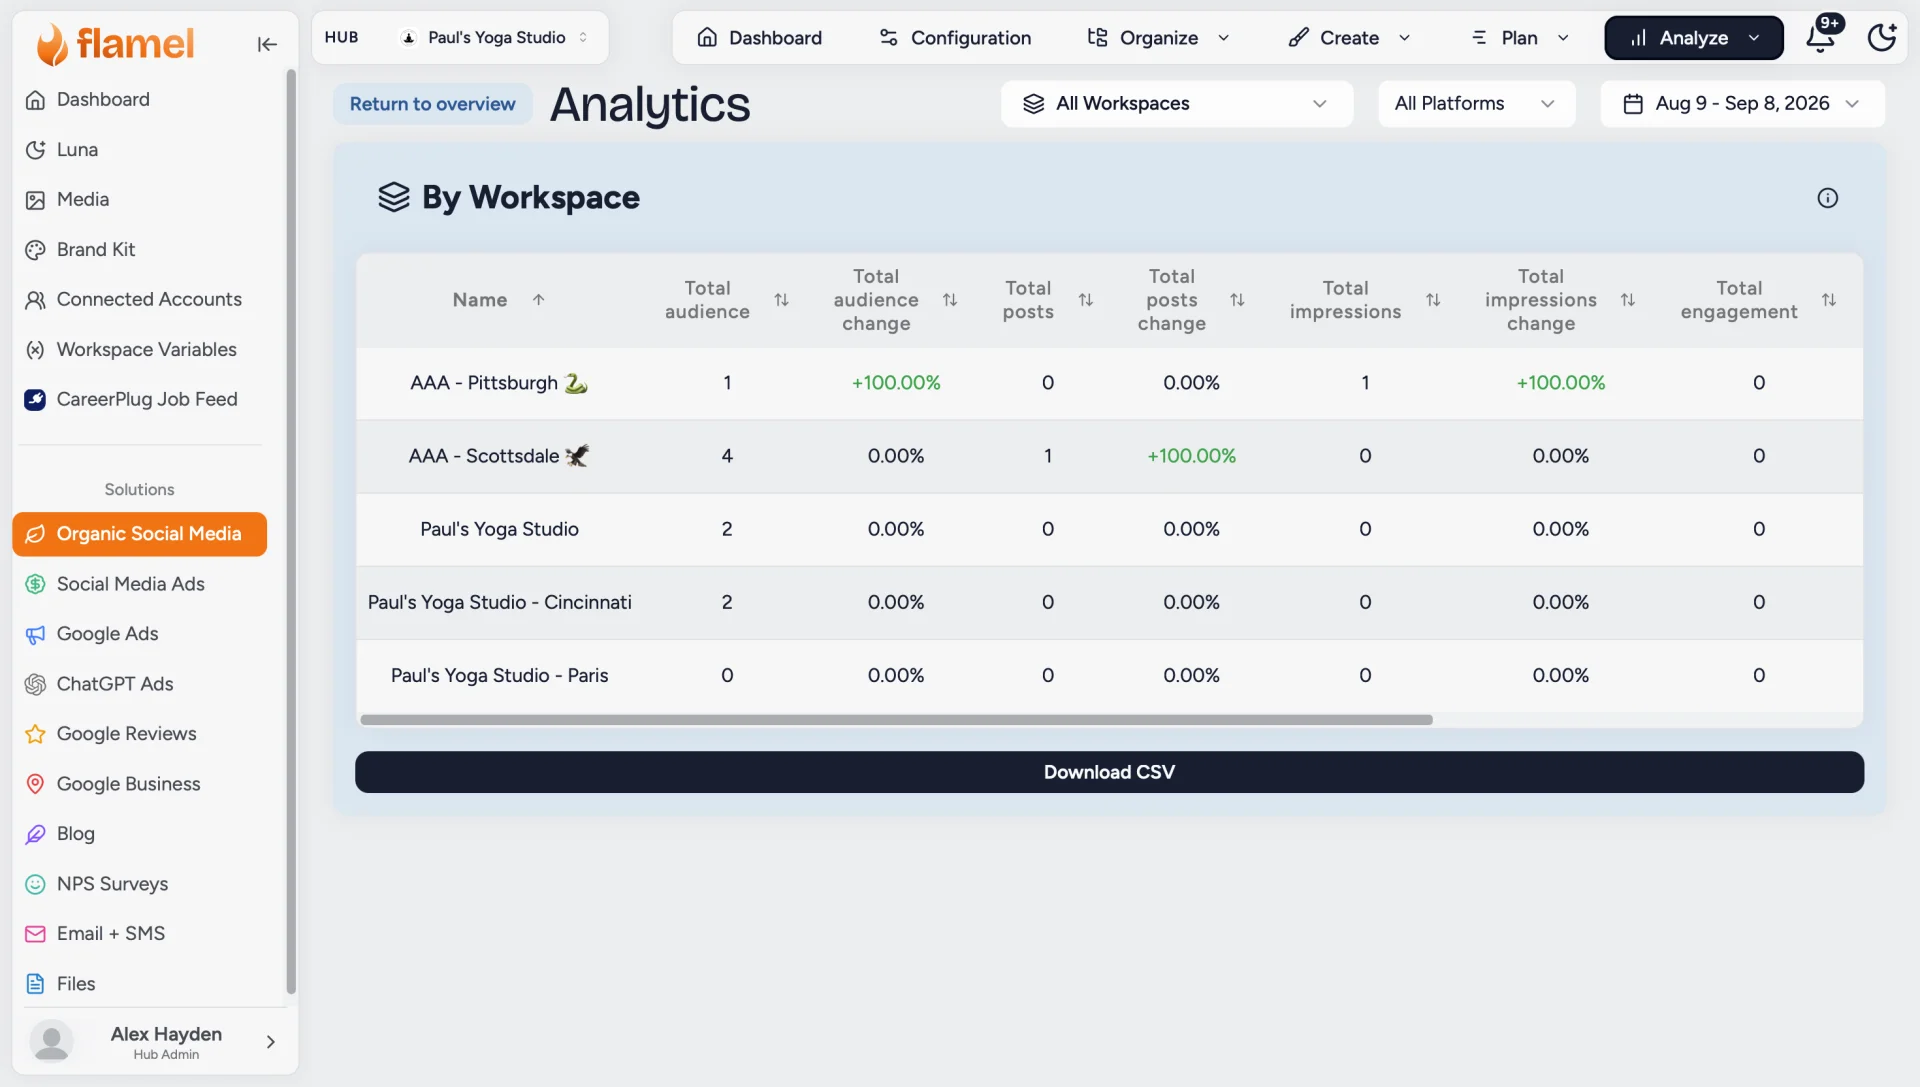
The By Workspace view in Organic Social gives you a network-wide look at how each franchise location is performing.
How to View Workspace Performance
Open Organic Social from the sidebar.
From the banner at the top, click Analyze.
Select By Workspace.
Review the performance metrics for each workspace.
You can compare locations across metrics including:
| Metric | What It Shows |
|---|---|
| Total Audience | The total social audience for the workspace. |
| Audience Change | How the workspace's audience has changed. |
| Total Posts | How many posts the workspace published. |
| Posts Change | How posting volume has changed. |
| Total Impressions | How many times the workspace's content was viewed. |
| Impressions Change | How impressions have changed. |
| Total Engagement | The total interactions generated by the workspace's content. |
| Engagement Change | How engagement has changed. |
| Average Engagement Rate | The average rate at which audiences interacted with content. |
| Engagement Rate Change | How the workspace's engagement rate has changed. |
You can filter the table by these metrics to quickly find the workspaces that are leading, improving, or falling behind.
Download Workspace Data
Need to dig deeper or share the results with your team? Use the Download CSV option to export the workspace data and analyze it outside of Flamel.
What Can You Learn From Organic Social Data?
Comparing locations isn't just about finding the workspace with the biggest audience. Looking at multiple metrics together can reveal why some locations are performing differently.
Find Your Top-Performing Locations
Look for workspaces with high engagement, impressions, or engagement rates.
These locations can provide examples of what is working across your network. Review their content and posting habits to identify ideas that could be replicated elsewhere.
Top Content
The Top Content section in Flamel shows your highest-performing posts in a ranked list. Use it to identify the specific posts (and the patterns behind them) that drove your best results.
Identify Locations That Need Support
A workspace with declining impressions, engagement, or audience growth may need additional support.
For example, a location with a high audience but consistently low engagement could have an opportunity to improve its content strategy rather than increase its posting frequency.
Compare Posting Activity With Results
Look at Total Posts alongside Total Impressions and Total Engagement.
If one location is posting significantly more but generating similar results to locations that post less, posting more frequently may not be the answer. The content itself may need to improve.
Find High-Engagement Locations With Smaller Audiences
A smaller location can still have a highly engaged audience.
Comparing Audience with Engagement Rate can help you find locations that are building strong local relationships even if they don't have the largest following.
These locations may have content strategies worth sharing across the network.
Spot Changes Over Time
The change metrics can help you identify locations that are gaining momentum or starting to decline.
For example:
- Audience is increasing + engagement is increasing → identify what is driving growth.
- Posts are increasing + engagement is decreasing → review content quality and variety.
- Posts are decreasing + impressions are decreasing → the location may need help maintaining consistency.
- Impressions are increasing + engagement rate is decreasing → content is reaching more people but may not be resonating as strongly.
Compare Paid Advertising Performance by Workspace
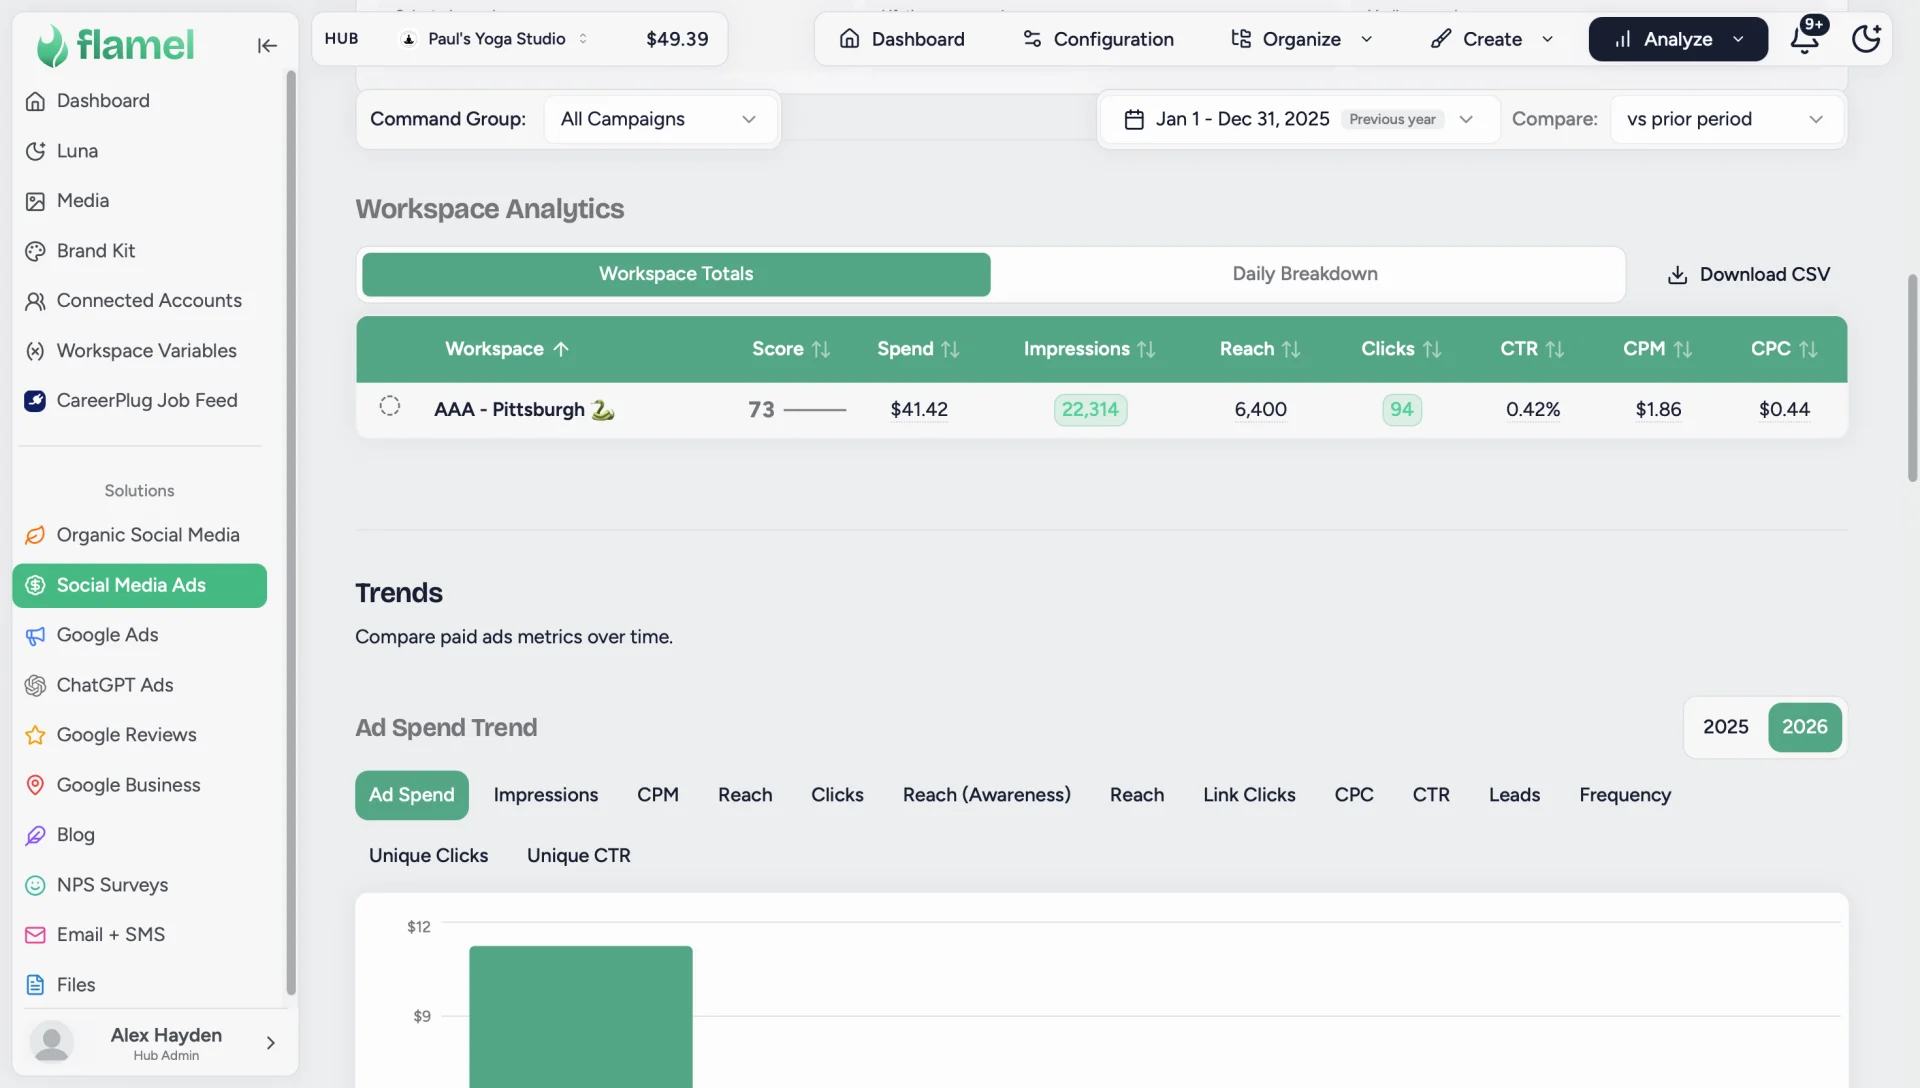
You can compare the performance of paid advertising across your franchise locations.
Paid advertising analytics are available in Flamel's Meta Ads, Google Ads, and ChatGPT Ads solutions.
How to View Workspace Ad Performance
Open the relevant paid ads solution.
Click Analyze from the banner at the top.
Select Analytics.
Scroll to Workspace Analytics.
The Workspace Totals view lets you compare advertising performance across locations.
Depending on the solution and available data, you can review metrics such as:
| Metric | What It Shows |
|---|---|
| Status | The status of the workspace's advertising data. |
| Workspace | The franchise location being measured. |
| Score | The workspace's overall advertising performance score. |
| Spend | How much was spent on advertising. |
| Impressions | How many times ads were displayed. |
| Reach | How many people saw the ads. |
| Clicks | Total ad clicks. |
| CTR | The percentage of impressions that resulted in clicks. |
| CPM | Cost per 1,000 impressions. |
| CPC | Average cost per click. |
| Reach (Awareness) | Reach attributed to awareness-focused campaigns. |
| Reach Rate | The percentage of the available audience reached. |
| Cost/Reach | The cost associated with reaching people. |
| Link Clicks | Clicks on links in the ads. |
| Link Click Rate | The percentage of impressions resulting in link clicks. |
| Cost/Link Click | The average cost for each link click. |
View Daily Performance
The Daily Breakdown section lets you see how advertising performance changes from day to day.
You can use this view to track metrics including Spend, Impressions, Reach, Clicks, CTR, CPM, CPC, Reach Rate, Link Clicks, Link Click Rate, and Cost/Link Click.
This can help you identify spikes, drops, and changes in performance that may be hidden when looking only at the workspace's overall totals.
What Can You Learn From Paid Social Data?
Identify Locations Getting the Most From Their Budget
Compare Spend against metrics like Clicks, Reach, CPC, and Cost/Link Click.
A location spending more isn't necessarily performing better. Looking at efficiency metrics can show which locations are generating stronger results from their budgets.
Find Locations With High Reach but Low Engagement
A workspace may generate strong impressions and reach without generating many clicks.
This can indicate that ads are successfully getting attention but may need stronger creative, messaging, or calls to action.
Find Efficient Locations
Look for workspaces with lower CPC, CPM, or Cost/Link Click compared with other locations.
These locations may be running particularly effective campaigns or targeting audiences efficiently.
Compare Locations With Similar Budgets
Comparing workspaces with similar levels of spend can provide a more meaningful performance benchmark.
For example, if two locations spend roughly the same amount but one generates significantly more link clicks, investigate what is different about its campaigns, creative, audience, or offer.
Turn Location Data Into Action
The goal of workspace analytics isn't to create a leaderboard. Use the data to find patterns and take action across the network.
When reviewing your locations, ask:
- Which locations are consistently outperforming the network?
- Which locations are improving the fastest?
- Which locations are declining?
- Are locations posting consistently?
- Does higher posting frequency actually correspond with better engagement?
- Which locations have strong engagement despite smaller audiences?
- Which locations are spending the most on ads?
- Which locations are getting the best results from their spend?
- Are there locations with high reach but low engagement or clicks?
- What are your top-performing locations doing that other locations could replicate?
Use these insights to share successful strategies, identify locations that need support, and make more informed network-wide marketing decisions.
Related Articles
Learn how to monitor organic social media performance and understand the metrics available in Flamel.
Learn how to monitor paid ads performance and understand the metrics available in Flamel.
Identify which posts are driving the most impressions and engagement so you can replicate what works.